The Highest Point on Venus
This study identifies the highest elevation on Venus as 10690m above the mean planetary radius (MPR) of 6051.8 km, at 64.787°N, 0.878°E on Maxwell Montes, using two complementary topographic datasets from NASA’s Magellan mission. The first is a global digital elevation model (DEM) with a horizontal resolution of 4.6 km per pixel [1], derived from radar altimetry and still the most complete and widely used source of Venusian elevations. The second is a higher-resolution DEM produced in 2012 by Robert Herrick and colleagues [2], which combines stereo pairs of Magellan radar images with the altimetry data to improve horizontal detail and local elevation estimates over the ~21% of the surface covered by stereo imagery.
Regional Setting of the Study Area
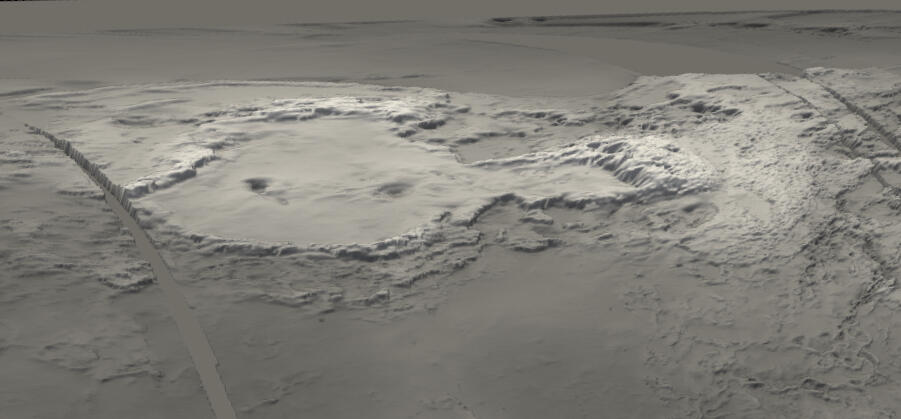
Fig 1
The surface of Venus comprises smooth lowlands and rolling plains near MPR, extensive rift zones with canyons plunging more than 3 km below MPR, and highlands rising over 3 km above it. The two largest highland regions are Aphrodite Terra at the equator and Ishtar Terra at high northern latitudes. Ishtar Terra - shown in Fig 1 as a 3D render from the Global DEM - is dominated by the spoon-shaped volcanic plain Lakshmi Planum, the only area on Venus encircled by true mountain belts. Peaks around the oval 'paddle' of this 'spoon' reach nearly 7 km above MPR, but the planet’s highest point lies in Maxwell Montes, an immense range at the end of the 'handle' of the 'spoon'. Maxwell Montes is thought to have formed from large-scale crustal compression, where the surface has been thrust and folded into a dense network of ridges and scarps.
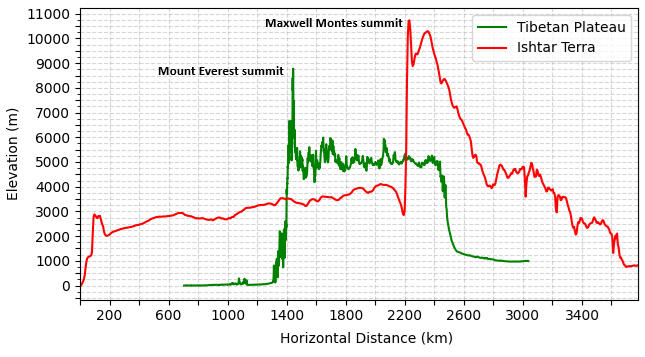
Fig 2
Fig 2 presents an east-west elevation profile across Ishtar Terra. The relationship of Maxwell Montes to the highland on which it stands is similar to that of the Himalaya to the Tibetan Plateau. However Ishtar Terra is continental in scale - comparable in extent to Australia (with Aphrodite Terra similar to South America). As shown in Fig 2, Maxwell Montes rises higher above Lakshmi Planum than Everest does above the Tibetan Plateau, and attains a greater elevation above MPR than Everest does above sea level.
Analysis
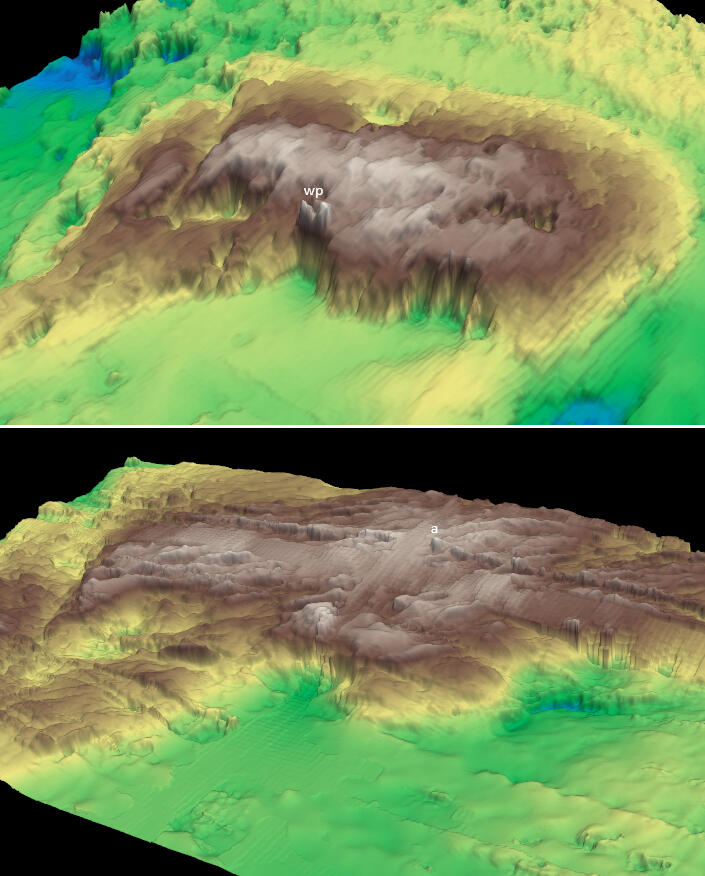
Fig 3
The top panel of Fig 3 is a 3D elevation-colour-coded render of Maxwell Montes using the Global DEM, and the bottom panel with the Stereo DEM. Both are shown with vertical exaggeration. The former appears smooth and continuous because it is built from a single, uniform data source but its coarse 4.6 km cells limit fine detail. Conversely, the Stereo DEM reveals more terrain detail, but also suffers from significant discontinuities. There are broad swaths where stereo data is missing or unreliable, and the model falls back on lower-resolution altimetry; when these coarse zones are resampled to a finer grid, they produce the blocky and corrugated 'tank tracks'.Additional spike-and-dip distortions occur at overlaps between stereo tiles due to mosaicking artifacts. For example, the highest point in the Stereo DEM, marked 'a' in Fig 3 (bottom panel), is likely such an artifact. The entire spine-like row running left to right through the image, of which this 'peak' forms a part, coincides with a mosaicking seam - one that has proven particularly troublesome. The difficulty likely stems from the spacecraft’s high-altitude elliptical orbit during imaging, which amplified pointing errors and, in turn, surface-location errors. These errors manifest as step-like discontinuities in models of relative elevations, such as the Stereo DEM. High-/low-pass filtering with altimetry removes the steps but leaves residual low-high 'singlets' at the mosaic boundary, of which 'a' is an example. If however a suspected anomaly extends for several kilometres away from a mosaic boundary at a comparable elevation, and shows some correlation with Global DEM trends, it is more likely to be real.
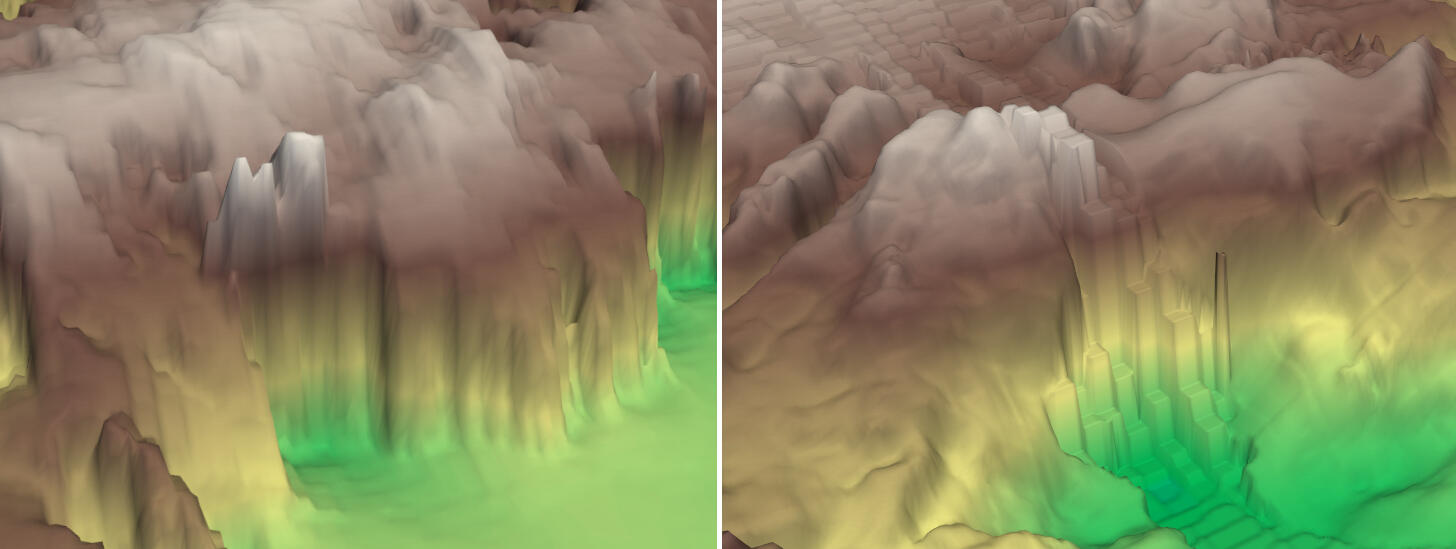
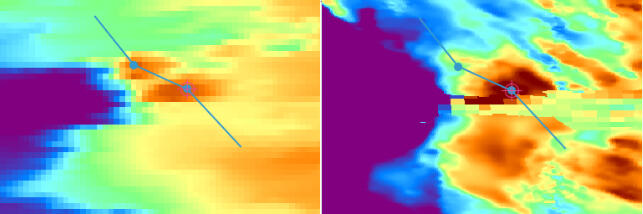
Fig 4
The brightest areas of the 3D render of the Global DEM in Fig 3 (top panel) are regional high points across the broad, expansive top of Maxwell Montes. It is clear however that the highest points occur on two distinct formations perched on the steep scarp along the massif’s mid-western edge, labelled 'wp' in the image. These rise well above the surrounding terrain, and we will refer to them here as the western pinnacles. Although the Stereo DEM render in Fig 3 (bottom panel) shows 'tank tracks' across this area, the right pinnacle and its immediate surroundings adjacent to a 'track' remain intact. The terrain to its left - including the left pinnacle - is also preserved in the Stereo DEM, but appears far less prominent than in the Global DEM. Fig 4 (top panels) provides zoomed-in 3D renders of this region in both DEMs for comparison.
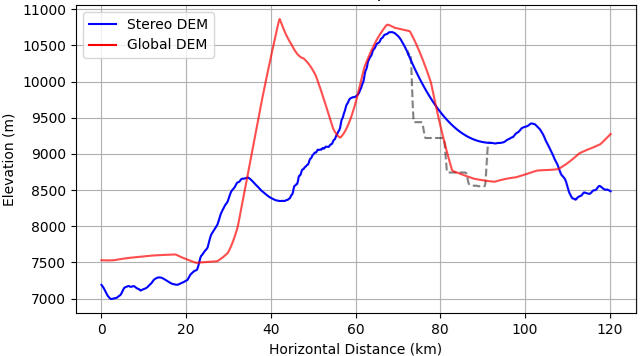
Fig 5
Fig 5 shows elevation profiles from both DEMs along the transect crossing the western pinnacles in Fig 4 (bottom panels). The perforated grey line is of a 'tank track' cross-section adjacent to the right pinnacle, and the solid blue line across this section is an interpolated profile. These plots make clear that the Stereo DEM strongly suppresses the left pinnacle (which appears highest in the Global DEM), whereas the right pinnacle matches closely in both shape and elevation - differing by less than 2% between the datasets, per Table 1.
| Digital Elevation Model | Coordinates of right pinnacle (lat, lon) | Elevation of right pinnacle |
|---|---|---|
| Global DEM | [64.801, 0.769] | 10831m |
| Stereo DEM | [64.787, 0.878] | 10690m |
Table 1
Accordingly, we interpret the Stereo DEM profile as a refinement of the Global DEM in this area, and take the slightly lower elevation of the right pinnacle in the Stereo DEM as the best estimate for the highest point, or summit, of Maxwell Montes.The inflated size of the left pinnacle in the Global DEM, not corroborated by the Stereo DEM, suggests it's an artifact of the Global dataset. The steep western scarp in our study area has been identified previously [3], and such features can produce complex altimeter waveforms with multiple power peaks and range ambiguities, resulting in exaggerated highs [4]. Thus, the left pinnacle in the Global DEM is likely a radar-altimetry artifact rather than a true summit.
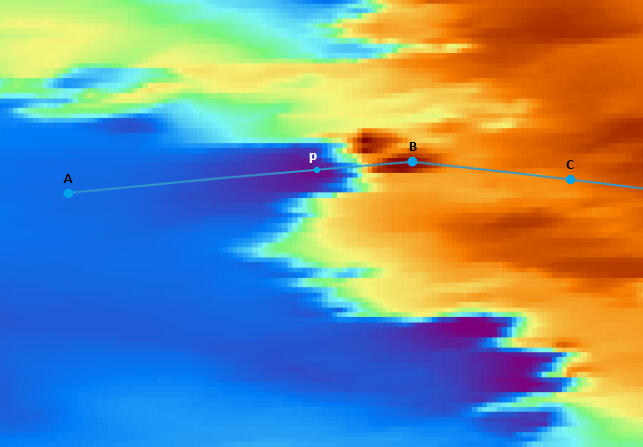
Fig 6
Figs 7 and 8 illustrate the size and steepness of the western scarp. Fig 7 plots the elevation profile along the transect shown in Fig 6, extending from Lakshmi Planum across the summit of Maxwell Montes. Point p marks a shallow foredeep - a flexural trough at the base of the scarp formed by the loading of the mountain mass on the lithosphere. This point, representing the scarp’s lowest base on Lakshmi Planum, is placed by both DEMs at ~2750m, about 1.3 km below the surrounding plateau. From this foredeep to the summit (Point B: 10690m), the scarp rises 7940m.
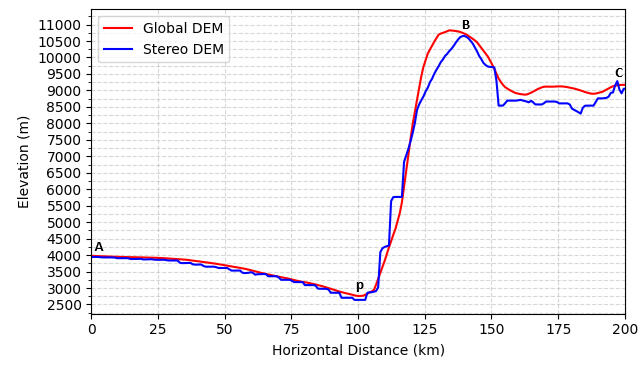
Fig 7
Fig 8 highlights how steep this rise is: by comparison, the Everest massif climbs from under 200m on the Indian plains to the 8848m summit over ~140 km - the shortest distance on Earth over which such an elevation gain occurs above sea level. If we align the base of the Maxwell Montes western scarp with the same starting elevation, it rises nearly 8 km over only 30 km horizontally.
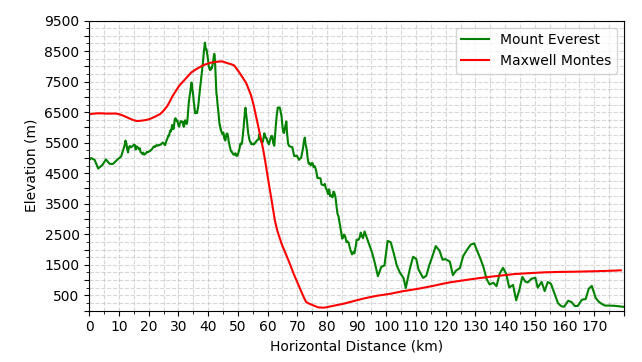
Fig 8
Fig 9 (top panel) shows a zoomed-in 3D render of the Maxwell Montes summit with the Stereo DEM. A terrain reconstruction across this gap - by algorithmically detecting sharp elevation changes at the 'track' edges and applying cubic interpolation - yields the smooth, internally consistent surface shown in Fig 9 (bottom panel). This indicates that elevations on either side reasonably represent the underlying topography.
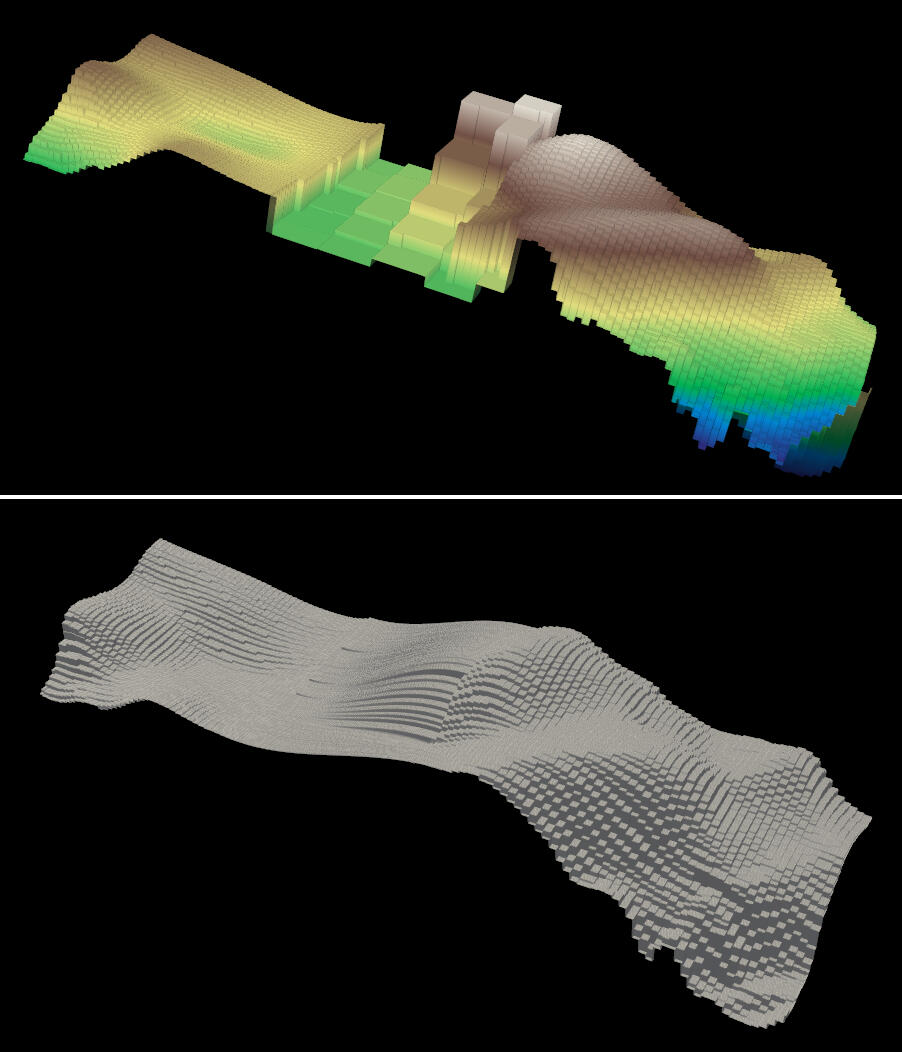
Fig 9
Methods
All 3D terrain renders in this work were generated using custom Python scripts applied to GeoTIFF exports from Venus QuickMap [5]. 2D colour-coded-elevation maps with transects were obtained as screenshots of QuickMap DEM layers, and elevation profile graphs were produced by processing QuickMap transect-elevation CSV file exports with Python scripts.
Reported Elevations
Values reported for the elevation and location of Venus’ highest point vary widely across the literature, with inconsistent definitions and missing information. Published heights include 10 km [6-9], 10.4 km [10][11], 10.7 km [12], 11 km [13-17], 11.5 km [18][19], and 12 km [20]. In all of these sources, the reference surface is either not stated or is vaguely described as 'above reference level', 'above mean elevation', 'above MPR', 'above average level', or 'above surrounding plains', without providing a numerical datum. This lack of a clearly defined reference severely limits morphometric analysis, since elevations must be tied to an explicit datum to allow meaningful comparison, interpretation, and refinement.Only a few sources supply such information. For example, [21] lists the highest point as 12 km above the modal radius of 6051.4 km, but does not specify the data source or coordinates. Likewise, [22] gives 11 km above the same 6051.4 km surface, referring to it as the 'mean radius'. Yet the same document attributes its altitudes to USGS small-scale Magellan-derived maps (1:10,000,000) [23], which themselves list a 6051 km datum for elevations from -3 to +11 km. The elevation-colour-coded I-2490 maps covering Ishtar Terra in this set of maps are shown in Fig 10. They lack sufficient resolution to locate the true summit of Maxwell Montes, and again do not provide coordinates of the highest point.
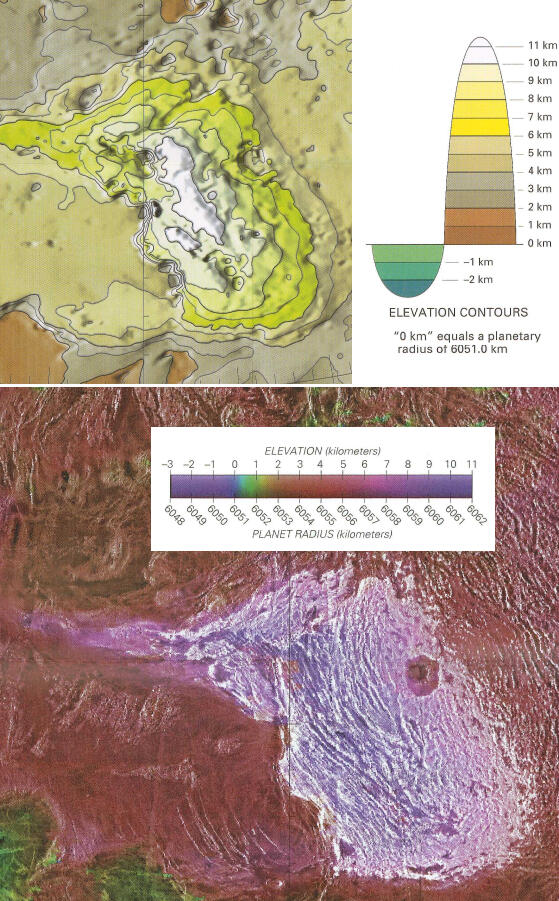
Fig 10
The original mission altimetry reports yield clearer data. For example, [24] reports that Venera 16 (1984) measured the highest point at 11.5 km above a 6051 km datum sphere, at 2.3°E, 65.9°N. Similarly, [25] states that Magellan data place the planet’s highest part at a radius of 6062 km, around 65°N, 3°E. When converted to the 6051.8 km datum used in this study, these correspond to elevations of 10.7 km (Venera) and 10.2 km (Magellan). As shown in Fig 11, both represent local highs on the broad crest of Maxwell Montes rather than the true summit identified here. The Stereo DEM does not cover the Venera point, but the Global DEM shows a slightly displaced local high with an elevation of 10.30 km. The Magellan point is covered by both DEMs; here the local high is again slightly offset from the mission-reported coordinates. According to the Stereo DEM it reaches 10.315 km, with the Global DEM giving a value within 0.5% of this.
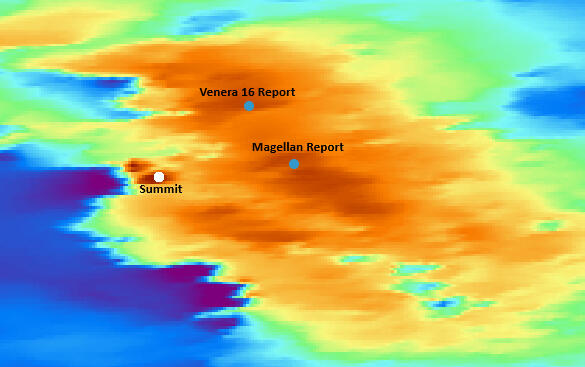
Fig 11
Published estimates of how far Maxwell Montes rise above Lakshmi Planum - the vertical relief between the summit and the highland base on which it stands - also vary widely. Source [26] gives 8 km, [27] 7 km, [28] 6 km, and [29] 5 km. None of these sources explicitly describe or illustrate the locations between which the relief is measured. Source [29] attributes its value to Magellan data, and for the others this can reasonably be inferred. The estimate in [26] most closely matches the 7.94 km relief determined in this study, measured from the foredeep at the base of Maxwell Montes’ western scarp to the summit.
Author
This study was carried out by Jim Singh and completed on 21 September 2025. It stems from an ongoing collaboration with Daniel Quinn and Oscar Argudo to systematically catalogue all lunar and Martian mountains and craters with topographic prominence (or anti-prominence) of at least 1000m. The effort builds on a 2024 publication documenting 7149 such features on Earth. Progress updates are available at WorldRibus.org.
Acknoweldgments
Thanks to Dr. Robert R. Herrick (University of Alaska Fairbanks) for valuable advice and feedback.
References
[1] USGS (1997) Venus Magellan Global Topography 4641m
https://astrogeology.usgs.gov/search/map/venus%5Fmagellan%5Fglobal%5Ftopography%5F4641m[2] NASA PDS Geosciences Node (2012) Venus Magellan Stereo Topography
https://pds-geosciences.wustl.edu/mgn/urn-nasa-pds-magellan%5Fstereo%5Ftopography/[3] Ford, P. G. & Pettengill, G. H. (1992). Venus topography and kilometer-scale slopes. Journal of Geophysical Research, 97(E8), 13 103–13 114. https://doi.org/10.1029/92JE01085[4] Gallardo i Peres, G., Mason, P. J. & Ghail, R. C. (2025). A map of potential topographic anomalies on Venus. Journal of Geophysical Research: Planets, 130, e2024JE008778. https://doi.org/10.1029/2024JE008778[5] Applied Coherent Technology. Venus QuickMap [Interactive map].
https://venus.quickmap.io/[6] Lefèvre, M., Spiga, A. & Lebonnois, S. (2020). Mesoscale modeling of Venus’ bow-shape waves. Icarus, 335, 113376. https://doi.org/10.1016/j.icarus.2019.07.010[7] Ansan, V., Vergely, P. & Masson, Ph. (1996). Model of formation of Ishtar Terra, Venus. Planetary and Space Science, 44(8), 817-831.[8] Wieczorek, M. A. (2015). Gravity and Topography of the Terrestrial Planets. In Elsevier Reference Module in Earth Systems and Environmental Sciences. Elsevier B.V.[9] Kaula, W. M., Bindschadler, D. L., Grimm, R. E., Hansen, V. L., Roberts, K. M. & Smrekar, S. E. (1992). Styles of deformation in Ishtar Terra and their implications. Journal of Geophysical Research, 97(E10), 16 085-16 120. https://doi.org/10.1029/92JE01643[10] Landis, G. A. (2008). Exploring Venus. MIT Department of Aeronautics & Astronautics. NASA Technical Report: https://ntrs.nasa.gov/api/citations/20090001338/downloads/20090001338.pdf[11] Landis, G. A. (2010). Low-altitude Exploration of the Venus Atmosphere by Balloon. Paper 2010-628, 48th AIAA Aerospace Sciences Meeting, Orlando, FL, January 6–9, 2010. NASA Technical Report: https://ntrs.nasa.gov/api/citations/20110016033/downloads/20110016033.pdf[12] Harris, N. (2020). Making mountains, on Earth and beyond. Proceedings (The Open University).[13] Rastegar, S. & Jurdy, D. M. (2018). Venus’ Ishtar Terra: Topographic Analysis of Maxwell, Freyja, Akna and Danu Montes. 16th VEXAG Meeting, LPI Contribution No. 2137.[14] Campbell, D. B., Head, J. W., Harmon, J. K. & Hine, A. A. (1983). Venus: Identification of banded terrain in the mountains of Ishtar Terra. Science, 221(4611), 644-647. https://doi.org/10.1126/science.221.4611.644[15] Namiki, N. (1993). The gabbro-eclogite phase transition and the elevation of mountain belts on Venus. Journal of Geophysical Research, 98(E8), 15 025-15 031.[16] Singh, D. (2019). Venus nightside surface temperature. Scientific Reports, 9, 1137. https://doi.org/10.1038/s41598-018-38117-x[17] Young, C. (Ed.). (1990). The Magellan Venus Explorer’s Guide. JPL Publication 90-24, August 1, 1990.[18] Garvin, J. B. (1984). Venus: Global radar properties in a geological context. 15th Lunar and Planetary Science Conference, Lunar and Planetary Institute.[19] NASA/JPL (1996). Venus - Lakshmi Planum and Maxwell Montes [Image]. https://www.jpl.nasa.gov/images/pia00241-venus-lakshmi-planum-and-maxwell-montes[20] Ivanova, M. A. & Head, J. W. (2008). Formation and evolution of Lakshmi Planum, Venus: Assessment of models using observations from geological mapping. Planetary and Space Science, 56, 1949-1966.[21] Fegley, B. Jr. (2003). Venus. In Treatise on Geochemistry (pp. 487-507). Elsevier Ltd. ISBN 0-08-044336-2.[22] Hamilton, W. B. (2005). Plumeless Venus preserves an ancient impact-accretionary surface. Geological Society of America Special Paper 388.[23] U.S. Geological Survey, Water Resources Division. (1997). The Ishtar Terra region of Venus in four map sheets: (1) Radar image map; (2) Radar image and shaded relief map; (3) Altimetric radar image map; and (4) Topographic map (IMAP 2490). U.S. Geological Survey. https://doi.org/10.3133/i2490[24] Rzhiga, O. N. (1987). Venera-15 and -16 spacecraft: Images and maps of Venus. Advances in Space Research, 7(12), 269-278. doi:https://doi.org/10.1016/0273-1177(87)90229-8[25] Pettengill, G. H., Ford, P. G., Johnson, W. T. K., Raney, R. K., & Soderblom, L. A. (1991). Magellan: Radar performance and data products. Science, 252(5003), 260–265. doi:10.1126/science.252.5003.260[26] Hurwitz, D. M. & Head, J. W. (2008). Geologic mapping of the North Polar Region of Venus (V1-Snegurochka Planitia): Implications for the evolution of volcanic activity. Lunar and Planetary Science XXXIX (Abstract 1388). https://www.lpi.usra.edu/meetings/lpsc2008/pdf/1388.pdf[27] Namiki, N. & Solomon, S. C. (1992). The gabbro-eclogite phase transition and the elevation of mountain belts on Venus. Abstracts of the Lunar and Planetary Science Conference, 23, 963.[28] Head, J. W., Vorder Bruegge, R. W. & Crumpler, L. S. (1990). Venus orogenic belt environments: Architecture and origin. Geophysical Research Letters, 17(9), 1337-1340.[29] NASA/JPL (1996). Venus - Lakshmi Planum and Maxwell Montes [Image]. https://www.jpl.nasa.gov/images/pia00241-venus-lakshmi-planum-and-maxwell-montes
Created by: Jim Singh - Electrical Engineer, Amateur Astronomer, Science Writer. Last Updated: September 2025. If you've found this site useful or have feedback, please drop me a line at jimmyboysingh. Follow that name with an at, then gmail and finish up with a dot and a com.